L1 /
13
CH3041


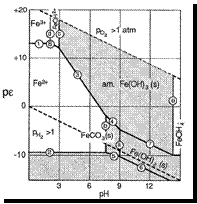
pE - pH DIAGRAMS

• pE - pH (or EH - pH) diagrams
are an easy way to visualise the
dominant species in a system as a function of both pH and pE.

The Fe-CO2-H2O
System
• Fe(OH)3 amorphous
FeCO3 siderite
• The main weakness
is no µ {activities}.
is no µ {activities}.
• Stability
field diags.
are for equilibrium
conditions. These
often do not hold.
are for equilibrium
conditions. These
often do not hold.

stability of
water lines
reducing
oxidising

natural pH range
