L1 /
16
CH1012


ORBITALS II

Radial
distribution
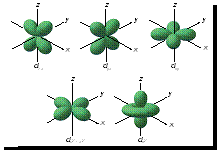
90% contour
plots
90% contour
plots

l = 0

l = 1

l = 2
n =
1
n = 2
n = 3
We use a 90% probability contour - inside
this region the e- spends 90% of its time.
this region the e- spends 90% of its time.
