L1 /
6
CH1012


PHASE DIAGRAMS II

Phase
Diagrams


2 Phases present
(equilibrium)
(equilibrium)
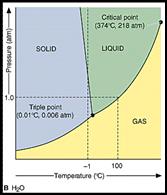
Freezing point curve

Boiling point curve
(V.P)

Sublimation curve (V.P)

Critical point (Tc, pc)
Tc = critical T
above which
higher p does not liquify
higher p does not liquify
pc = pressure at Tc
